LOCAL LLM FIELD GUIDE
Why LLM tok/s Hits Memory Bandwidth Bottlenecks
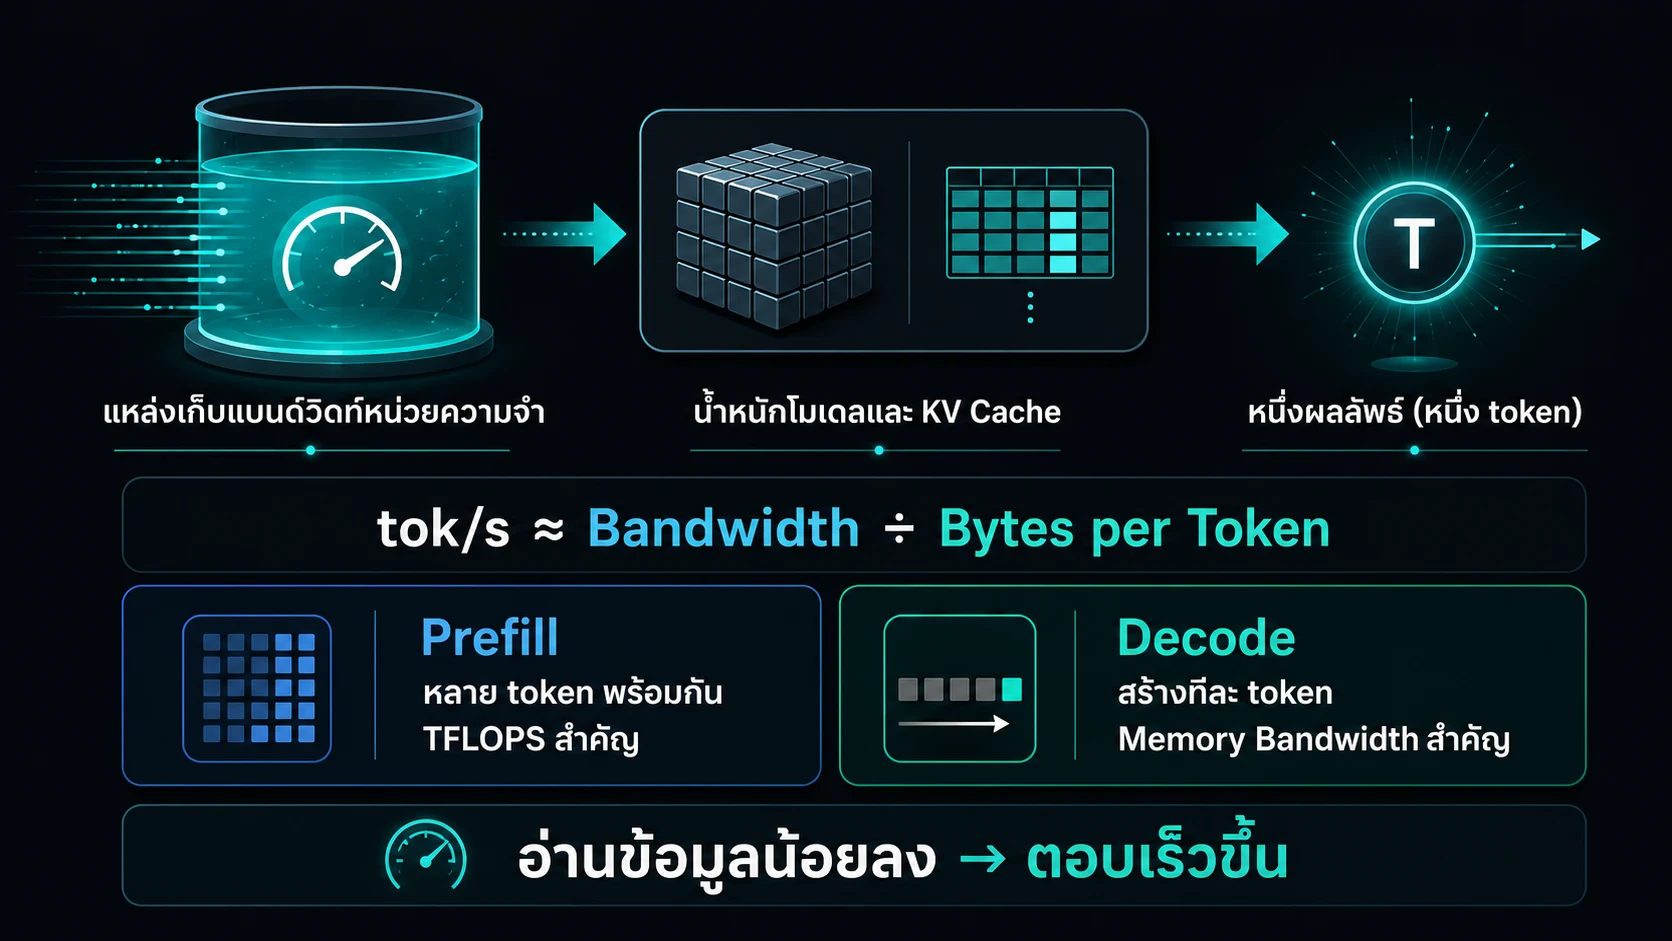
When running LLM inference, a common question is: why does a GPU with hundreds of TFLOPS only generate a few dozen decode tok/s? The answer lies in the Roofline Model: during Decode, generating every single token requires the server to repeatedly read tens of gigabytes of Model Weights through the Memory Bandwidth bus just to output one word! The primary bottleneck is not computation speed (Compute FLOPS), but data transfer speed (Memory Bandwidth).

ROOFLINE PERFORMANCE MODEL
This equation is a planning model, not a benchmark
Think of tok/s as available data movement, adjusted by the software path and bytes that must be read.
TRY IT
Prefill vs Decode: what actually limits speed
Toggle Prefill and Decode, then change hardware and weight format to see why decode tracks memory bandwidth while prefill tracks FLOPS. Numbers are a fixed 32B dense teaching sketch, not calculator output.
USE IT ON REAL WORK
Read tok/s for the thing you measured
Decode emits one output token at a time, so it often rereads weights and KV cache. Prefill accepts many prompt tokens together and has a different bottleneck.
The calculator helps rank options. Confirm latency, capacity, and cost decisions with an equivalent benchmark.
| Metric | Answers | Does not replace |
|---|---|---|
| TTFT | How long a user waits for the first token | Generation speed |
| ITL | Time between output tokens | Prefill time |
| output tok/s | Decode speed of one request | Aggregate throughput |
| peak memory | Headroom before OOM | Answer quality |
Keep these fixed when comparing
- The same model, quantization, and runtime
- The same working context and batch
- Comparable prompts, sampling, and power mode
- Measure TTFT, ITL, tok/s, and peak memory separately
readPerStepGB = (activeWeightsBytes + N * kvReadPerStreamBytes) / 1e9
tok/s_total = bandwidthGBps * frameworkEff * quantKernelEff
              * attentionEff * specMult(N) * N / readPerStepGB
Prefill and decode use the GPU differently
One of the largest sources of confusion in LLM benchmarking is using a single tok/s (Tokens per Second) metric to describe the entire user experience. In reality, the Transformer architecture divides inference into two distinct phases with fundamentally different GPU resource demands:
- Prefill Phase (Prompt Processing): The server reads and processes the entire input prompt at once. Because matrix multiplication (GEMM) across many tokens can be batched together, the GPU fully saturates its Tensor Cores. This phase is Compute Bound (TFLOPS). Longer prompts increase TTFT (Time to First Token).
- Decode Phase (Token Generation): The server generates output tokens autoregressively, one word at a time. To generate just 1 next token, the GPU must sweep through all model weights (tens of GBs) plus KV Cache memory across the GPU memory bus. This work is Matrix-Vector Multiplication (GEMV), processing very small matrix slices. This phase is heavily Memory Bandwidth Bound (GB/s).
This explains why a chatbot might have a slight initial delay (TTFT) while ingesting a long document, but streams words out at high speed once generation begins.
TTFT, TPOT, ITL, and E2E answer different questions
Reporting an average 45 tok/s for a production server ignores the real user experience! In inference engineering, latency must be split into 4 core metrics:
- TTFT (Time to First Token): Time from user prompt submission until the first token appears on screen. Includes queue time and total prefill processing. Slow TTFT makes system feel unresponsive.
- TPOT (Time Per Output Token): Average time to generate each token after the first token appears (reflects pure decode latency).
- ITL (Inter-Token Latency): Time gap between adjacent tokens during streaming. Critical for UX: an average TPOT may look good, but ITL spikes (stutters caused by scheduler prefill interrupts) create noticeable reading pauses.
- E2E Latency (End-to-End Latency): Total duration from request submission to final token completion.
The Golden Rule of Benchmarking: Always inspect median (p50) alongside tail metrics (p95 or p99) so averages do not hide latency spikes!
Bytes per token is the decode core
The core equation governing Decode Speed is defined by Bytes Read per Token.
In each Decode step, total memory data moved across the bus is:
Bytes Read = Active Model Weights + (KV Cache per sequence * Active Sequences) + Attention Metadata
For example, a 70B 4-bit model (~35 GB file size) running on a GPU with 1,000 GB/s Memory Bandwidth (e.g. RTX 4090):
- Running 1 request (Batch Size = 1) requires reading ~35 GB to generate 1 Token.
- Theoretical maximum Decode speed = 1,000 GB/s / 35 GB = ~28.5 tok/s.
This explains why weight quantization from 8-bit to 4-bit nearly doubles decode speed: it cuts the bytes read per step in half!
Context, output length, and concurrency move the bottleneck
Workload characteristics dynamically shift GPU bottlenecks:
- Long Prompts (RAG / Document Summarization): Heavy prefill workload pushes TTFT high and consumes massive KV Cache VRAM. Bottleneck shifts to Memory Capacity and Compute FLOPS.
- Long Outputs (Code Generation / Writing): Requires thousands of decode steps (e.g. 2,000+ tokens). Bottleneck shifts strictly to Memory Bandwidth.
- High Concurrency (Multi-user Enterprise Chatbots): Serving dozens of requests via Continuous Batching reuses model weights across requests, multiplying total server throughput (tokens/s across all users). However, it increases queue time, causes ITL spikes, and consumes KV Cache VRAM, risking OOM crashes.
Scheduling is a tradeoff, not a speed button
Continuous Batching and Chunked Prefill in modern engines (vLLM / SGLang) are performance tradeoffs, not free speed toggles:
- Chunked Prefill: Splits long prompts into smaller chunks inserted alongside decode steps of active requests. Reduces ITL spikes (streaming stutters), but adds runtime overhead and may slightly reduce aggregate server throughput.
- PD Disaggregation (Prefill-Decode Separation): Splits GPUs into dedicated Prefill nodes (Compute-focused) and Decode nodes (Bandwidth-focused). Enables independent tuning of both phases, but requires high-speed interconnects (NVLink / InfiniBand / RDMA) to transfer KV Cache states.
Read calculator estimates as estimates
The LLM VRAM Calculator computes Decode tok/s from GPU Memory Bandwidth, adjusted by framework efficiency, quantization kernel overhead, attention backends, and speculative decoding.
Calculator Estimate Guidance:
- Estimates represent steady-state speed on specified hardware architectures.
- Does not simulate traffic queueing dynamics, prefix cache hit rates, thermal throttling, or PCIe bus contention.
- Important: When a configuration triggers OOM, reported tok/s is strictly theoretical because the server will crash at boot in real life.
A minimum comparable benchmark pack
- Interactive chat512 or 2K input tokens, 128 output tokens, concurrency 1. Record TTFT, TPOT, ITL p95, and peak memory
- Long context32K input tokens or the real working context, 128 output tokens, concurrency 1 and 4. Record TTFT, prefill throughput, KV memory, and quality
- Shared prefixThe same system prompt or RAG prefix over many requests. Separate results with and without prefix cache
- Serving saturationA fixed arrival rate while raising concurrency stepwise. Record output throughput, queue time, TTFT p95, ITL p95, and errors or OOM
- Speculative decodeThe same prompt, sampling, and target with speculation off and on. Record acceptance, TTFT, ITL, output throughput, and peak memory
Make configurations traceable: Record the checkpoint and quant artifact, tokenizer and chat template, runtime version, driver, flags, clock or power mode, GPU count, and traffic file every time.
Validate with the workload
Proper benchmarking starts with warmup runs to prime caches, followed by multiple test runs simulating production prompts, context length, concurrency, and sampling.
Report median (p50) and tail (p95/p99) metrics for TTFT, ITL, Output Throughput, and Peak VRAM. Identify system bottlenecks using empirical data, not GPU marketing names or single tok/s figures.
Sources
Try your configuration
Put the intended model, quantization, context, framework, and hardware into the calculator, then validate with a production-like benchmark.
Open calculator